")
 (NYSEARCA:SPY)")
We’ve entered the September and October period, which is typically the worst seasonal stretch for stocks and this year has been no different. Market volatility has risen, asset prices have fallen and the media are doing a good job of stirring the pot and ensuring that there’s a healthy dose of fear in the market.
The OFR Financial Stress Index, which is provided by the Office of Financial Research is an overlooked measure for stress in the financial markets. The index is comprised of 33 financial market variables and as we showed in Part 1 and Part 2 of the series, it has predictive power for the S&P 500. When the FSI index is positive it means that stress levels are above average and worth taking note of, and when it is negative stress levels are less worrisome.
The index is comprised of a composite of the following market variables:
- Credit – Credit spreads, both HR and IG Corporate
- Equity valuation – Stock valuations, the stock index price levels
- Funding – Bank lending standards, credit conditions index
- Safe Assets – Valuations for assets like Yen, CHF, and Gold that are considered safe stores
- Volatility – VIX Index, Move Index, implied and realised volatility
What we are going to do in this article is revisit the research that showed the most optimal levels to follow for the indexes and then update on where we are and what levels you should watch out for moving forward, to better time asset allocation decisions.
This time we’re going to do this regionally, so you get a sense of where key world stock markets are in terms of financial stress.
Overview of the Financial Stress Index and S&P 500 (US Stocks)
The OFR Financial Stress Index has a regional filter that allows us to focus on the data for US stocks first. Let’s take a look at the bigger picture and then drill down:
OFR Financial Stress Index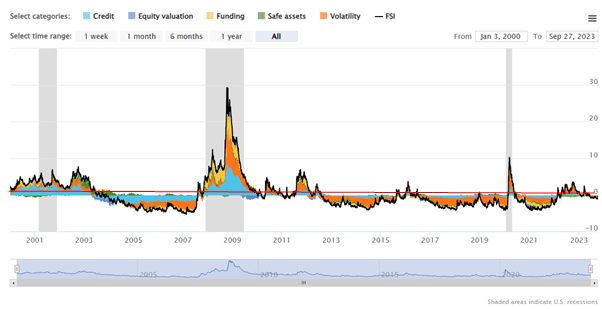
The FSI has done a good job of covering the recessions over the past 22 years and being aligned to forecasting them with a degree of accuracy.
Right now you can see that we are just hovering near the 0 mark. Historically – based on our previous Python-driven analysis – we found that a reading of 0.5 marked a turning point for the US FSI index and the S&P 500. The red line indicates a sell signal when stress is elevated enough to warrant reducing your equity exposure. We found that a system that followed buy and sell rules at this level beat the S&P 500 since 2000.
Here is a better view of the chart over the past 6 months:
OFR Financial Stress Index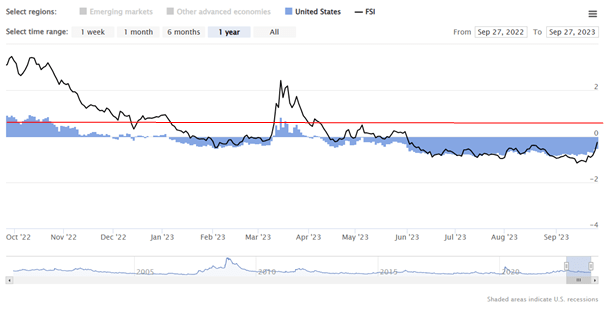
Today’s reading is -0.526. A reading of 0.5 or above for the US FSI would indicate a sell signal. This means that the stress in the financial system at that level, or above, is more closely associated with negative equity returns.
Put another way, this level indicates that volatility in the equity markets, credit markets, bank lending standards, and flight of investors’ funds to safe assets have reached a tipping point that suggests negative future returns for stocks. We’re not quite at this level but we could be approaching it soon – so caution is warranted.
Overall assessment for US stocks is a cautious buy until such a point that this indicator hits 0.5 for the US FSI index.
Overview of the Financial Stress Index and HSI Index (Asia Pac Stocks)
The OFR Financial Stress Index has a regional filter for Emerging Markets that is worth investigating. Let’s look at the bigger picture and then drill down:
OFR Financial Stress Index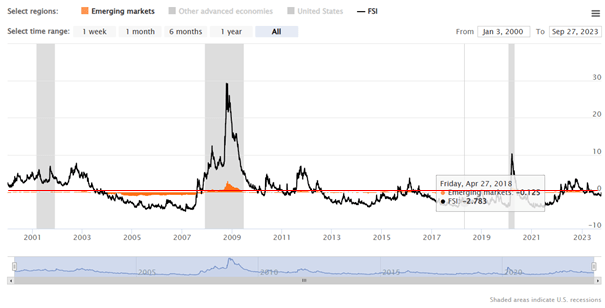
The FSI also has market-beating return potential when it is applied to the Hang Seng Index. I have yet to publish an article showing my workings here, but following the same logic that I used for the US FSI, I came to an interesting conclusion. The Hang Seng Index should be bought when the Emerging Markets FSI index is below -0.009 (very nearly 0 mark) and sold when it is above that level.
Here is a better view of the chart over the past 6 months:
OFR Financial Stress Index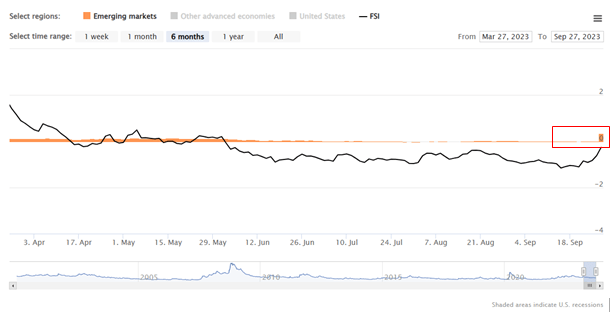
It’s very important to note that the black line is not the measure: the orange line, represents the Emerging Markets data and it currently shows a positive reading above 0.
Today’s reading is 0.323. A reading of -0.009 or above for the Emerging Markets FSI would indicate a sell signal. Just as above, this means that the stress in the financial system at that level, or above, is more closely associated with negative equity returns, which we are seeing in the Hang Seng Index.
The overall assessment for the Hang Seng Index is a cautious sell until a time when the Emerging Markets FSI index drops below -0.009.
Overall Assessment
Having built dozens of rules-based systems in the past, I have noticed one vital factor for success. You have to believe in your systems and follow them, rather than trying to front-run the results.
What the US FSI index tells me is that right now across a range of measures, which appear to correlate well with the S&P 500 index, the market is not yet showing signs of stress that would warrant panicking about your equity positions. These measures do appear to be accelerating, though, so it’s worth keeping an eye on the index during the month of October to see if we close in towards 0.5, which would indicate a sell signal.
The opposite is the case with the Hang Seng Index. The Emerging Markets FSI has been a sell for a long time. The index has consistently read above -0.009 and there is very real stress in the Chinese banking, credit, and volatility markets. Investors should be cautious by going too heavily over-weight stocks in the emerging markets until we see signs of stress at or below -0.009 on the FSI index.
Read the full article here

")
 (NASDAQ:PANW)")
")
")
")
 2026-04-06")
")
")