")


Whenever you find yourself on the side of the majority, it is time to pause and reflect.
– Mark Twain
Markets Take on Risk
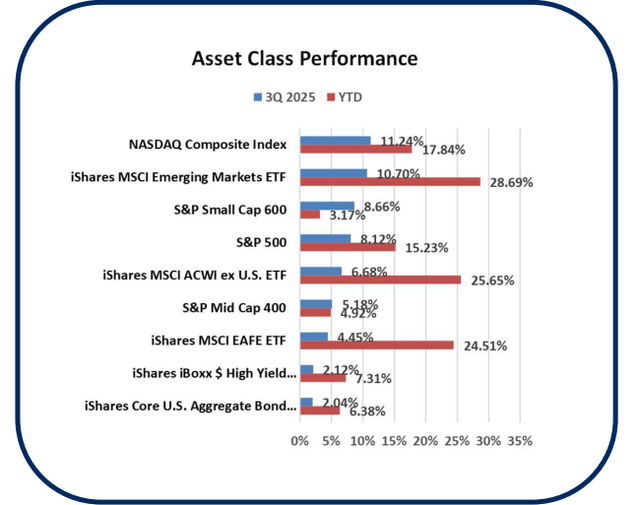
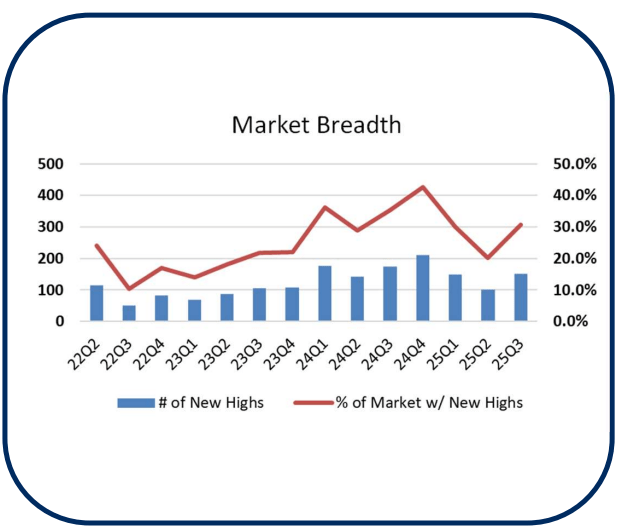
The dog days of summer for 2025 saw a continuation of the market’s rally off the April lows, following the volatility brought on by the tariff announcement or Liberation Day. Risk on assets, such as technology, small caps and emerging markets, were among the top performers in the third quarter. Indeed, the tech heavy Nasdaq led the charge with an 11.24% return, followed by a 10.70% return for Emerging Markets. Small Cap stocks also finally generated a favorable return, turning positive for the year with a third quarter return of 8.66%. Additionally, US market breadth improved with 30% of the S&P 500 constituents making a new all-time high in the third quarter, which led to a new high in the S&P 500 and a new high in the equal weighted S&P 500 Index. However, there remains a difference in return between both indexes due to the S&P’s high concentration in the Magnificent 7 stocks, which, in aggregate, returned just over 15% in the third quarter.
Several themes occurred throughout the quarter that contributed to the rally: better than expected fiscal policy from passage of the One Big Beautiful Bill Act (OBBBA) and so far, minimal effect tariffs have had on company earnings and the economy. The strength in corporate earnings for Q2 has led to a sequential increase in analyst estimates for forward earnings. Lastly, a moderating economy gave the Federal Reserve room to resume its easing cycle, which has been on pause since January 2025.
Fiscal Tailwinds
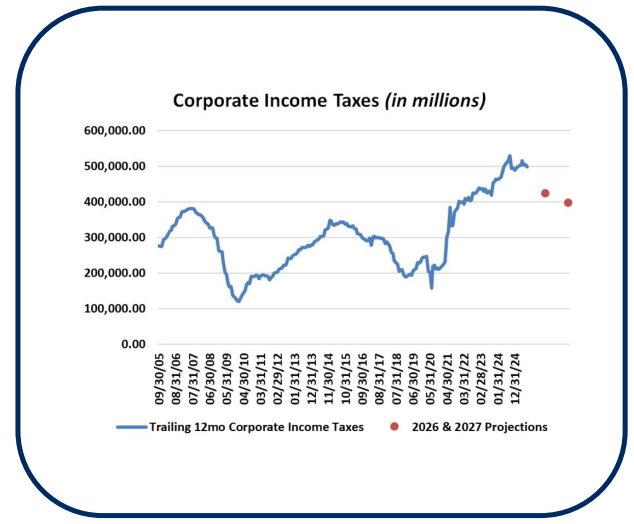
The third quarter started with the passing of the OBBBA, which included changes to the tax code for both personal and corporate taxes. According to the Tax Foundation, the OBBBA is expected to effectively reduce taxes for corporate entities by approximately $1 trillion over the next decade. This translates to a windfall of $71 billion for 2026, lowering projected corporate income taxes to ~$424 billion versus the previously estimated ~$495 billion. This ~$71 billion fiscal tailwind likely contributed to the summer rally in US equity markets as companies and analysts began to digest the positive impact of this stimulus.
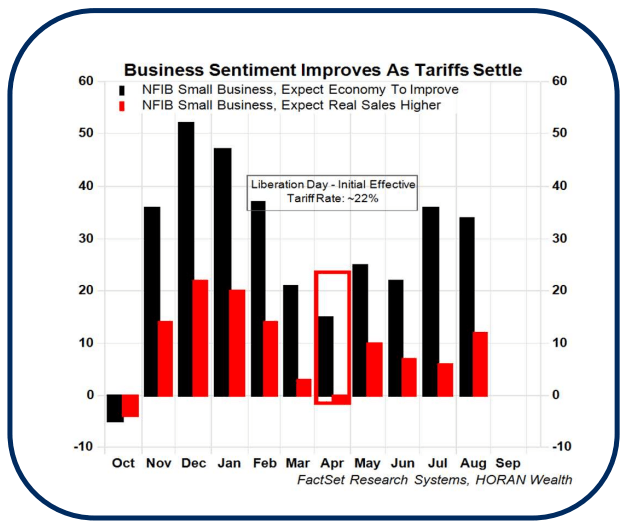
In addition to this fiscal easing, the effect tariffs have had on companies seems limited to date. More specifically, the initial effective tariff rate across all trade from Liberation Day’s ~22% has been revised down to 15.8% according to JPMorgan Global Research. While this is still a large increase from historical US tariff policy in prior decades, it is a better-than-expected outcome for the market. Indeed, forward optimism around both the economy and higher real sales saw a dip around the initial tariff announcement, followed by a gradual recovery as tariffs were generally revised lower. This favorable trend is highlighted by responses in the recent NFIB Small Business index survey. In the chart on the previous page, the black columns represent expectations around an improving economy, and the red columns represent expectations for higher real sales. Both categories are seeing an improvement in the months following April’s Liberation Day tariff announcement. The actual fiscal stimulus from the OBBBA, strong growth in corporate earnings, and the easing tariff conditions seem to be providing an additional tailwind for equities to climb to newer highs.
Analysts Surprised by Q2 Earnings
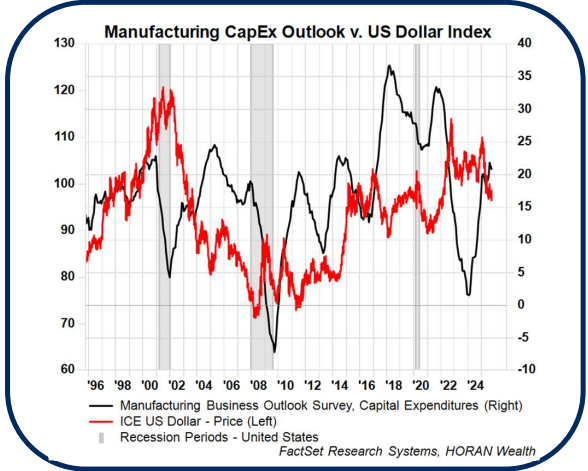
At the start of 2nd Quarter earnings season, Wall Street analysts had revised earnings growth expectations down to 5.8% from an expected 14.9% growth rate a year ago. The largest revisions downward included the Energy and Consumer Discretionary sectors, due to their sensitivity to global trade. Most of the revisions occurred following Liberation Day, as nearly 38% of S&P 500 constituents’ revenue comes from international markets. However, as earnings season progressed, most sectors reported strong earnings beats and generally positive outlooks on the economy. Anecdotally, two of the largest consumer goods providers, Wal-Mart and Procter & Gamble, stated they are able to pass along the impact related to tariffs and have not seen diminishing volumes as a consequence. As seen in the above chart, manufacturers’ future capital expenditure plans continue to recover from recent lows, partly driven by more clarity around US trade policy. The index is now a point higher than the peak prior to Liberation Day. Additionally, a weaker dollar may be contributing to this, as planned Cap Ex and the movement in the U.S. Dollar tend to have an inverse relationship. This inverse relationship occurs as international imports become more expensive, due to a weakened dollar, incentivizing US manufacturers to onshore production. If downward pressure on the dollar’s value continues, this effect may increase demand for domestic production, which could be a tailwind for US Payrolls and overall economic growth.
Labor Market Softness
Since 2022, the US economy has been much more resilient than previously believed, defying analyst expectations. Once again, it appears Wall Street has begun to see economic cracks, primarily within the labor market. The warning sign economists are pointing to is the recent revisions to the US non-farm payrolls data. In the July report, the Bureau of Labor Statistics revised payrolls down by 294,000 for the months of April, May, and June. However, revision data is noisy and there is no clear trend that payroll revisions have led to an economic recession.
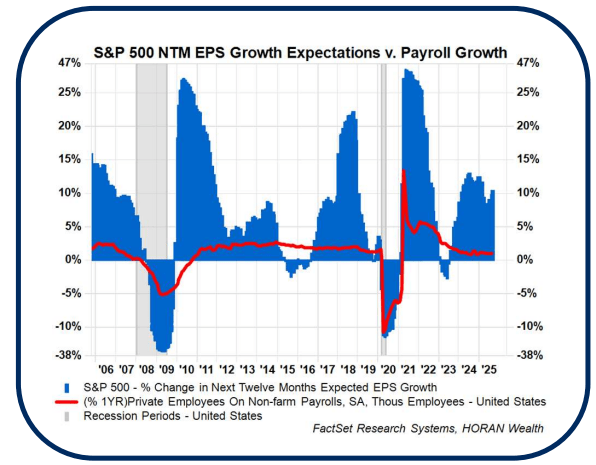
Additionally, declining payrolls tend to indicate the nearing of the bottom of a recession as payroll data is a lagging indicator. Therefore, investors should look for data that leads employment, which tends to be corporate profits. A proxy for where employment might be headed is to look at the forward expectations for earnings per share growth of the S&P 500 constituents as seen in the below chart.
Fed Resumes Rate Cut Cycle
Despite inflation remaining above the Federal Reserve’s two percent target, the Federal Open Market Committee (FOMC) decided to resume the rate cutting cycle. The FOMC announced a 25-basis-point rate cut in September, with only one member dissenting. The lone dissent came from newly appointed Fed Governor Miran, who favored a deeper 50-basis-point reduction. This decision places the Federal Funds target range at 4.00% to 4.25%. In the Fed’s statement, the Committee noted “recent indicators suggest that growth of economic activity moderated in the first half of the year.” Concern over potential downside risks to employment, a key component of the Fed’s dual mandate, was the primary catalyst for this policy adjustment. The Committee’s median projection at the September meeting also showed two more fed funds rate cuts in 2025.
A.I. Remains a Focus
A common investment theme over the past year or more is the focus on Artificial Intelligence (A.I.) This has led to a handful of stocks, the so-called Magnificent 7, becoming significant contributors to market returns as we have noted in prior quarterly Investor Letters. A.I. is believed to eventually become a large driver of economic growth; thus, A.I. has implications for companies and their stock price. Microsoft’s (MSFT) A.I. search engine, Copilot, defines A.I. as:
Artificial intelligence (AI) is the field of computer science focused on creating systems that can perform tasks typically requiring human intelligence. These tasks include reasoning, learning, decision-making, problem-solving, and even understanding language or recognizing patterns.
The unknown aspect of A.I. is the degree to which businesses and the economy benefit from incorporating A.I. into their various uses. In a recent study from MIT, where the survey interviewed 153 senior leaders across 52 organizations, the study summary noted 95% of organizations are getting zero return from enterprise investment in A.I.
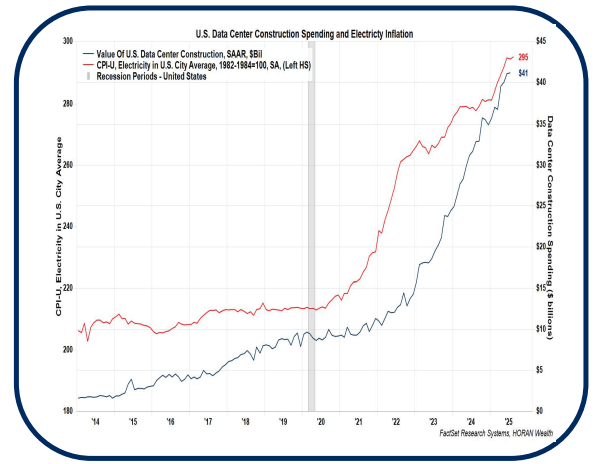
The other aspect of A.I. is the fact a great deal of front-end investment is being made in the buildout of the overall infrastructure that supports the industry. One critical component is access to data centers that can process the computing power that is required to process data. As the chart on the previous page shows, datacenter construction is growing exponentially, possibly creating overcapacity, just as fiber optic capacity was overbuilt in the lead up to the 2000 technology bubble.
In addition to data center access, power sources are required to run the computer equipment. The U.S. has underinvested in the electrical infrastructure/grid. The result is state regulators are allowing regulated utilities to pass through higher rates to help fund expansion of the electrical grid. The previous chart shows the steep rise in the consumer price index for electricity in the U.S. since 2000.
Conclusion
The U.S. economy remained resilient in the third quarter despite some softening in the labor market. The resiliency is being driven by the strength in consumer spending due to low unemployment, record highs in the stock market and firm housing prices. Although the Fed has raised concern about the health of the job market, the unemployment rate continues to be quite low. Corporate America continues to contribute healthy earnings growth and is generally in solid financial shape. Currently, Wall Street analysts are forecasting earnings growth to accelerate to 14.0% in 2026 compared to an expected 10.8% this year. We believe earnings growth will be key for further stock market gains as stock valuations look rich for some segments of the market. Additional interest rate cuts by the Fed would be a tailwind for the economy and earnings. An extended government shutdown could have a short-term negative impact on the economy, but equity markets do not seem overly concerned about this risk presently. While one could see a pause in the stock market after the strong rally from the April lows, the fourth quarter has historically been the best three-month period of the year for stocks.
Thank you for your continued confidence and support in HORAN Wealth and we are always available to answer your questions and discuss our outlook further. Please be sure to visit us for company news, reports, and our blog at Insights.
| HORAN Wealth, LLC is an SEC Registered Investment Advisor. The information herein has been obtained from sources believed to be reliable, but we cannot assure its accuracy or completeness. Neither the information nor any opinion expressed constitutes a solicitation for the purchase or sale of any security. Any reference to past performance is not to be implied or construed as a guarantee of future results. Market conditions can vary widely over time and there is always the potential of losing money when investing in securities. HORAN Wealth and its affiliates do not provide tax, legal or accounting advice. This material has been prepared for informational purposes only, and is not intended to provide, and should not be relied on for tax, legal or accounting advice. You should consult your own tax, legal and accounting advisors before engaging in any transaction. For further information about HORAN Wealth, LLC, please see our Client Relationship Summary at adviserinfo.sec.gov/firm/summary/333974. |
Original Post
Editor’s Note: The summary bullets for this article were chosen by Seeking Alpha editors.
Read the full article here
")
 Q4 2025 Earnings Call Prepared Remarks Transcript")