")


By John Baldi & Michael Clarfeld, CFA
Global Risks and High Market Prices Should Give Pause
Market Overview
The second quarter proved surprisingly good for U.S. equity investors. Despite trade wars, battlefield wars in Ukraine and the Middle East, declining earnings estimates and a deteriorating fiscal outlook, the S&P 500 Index is up 6.2% at the year’s halfway mark. Growth trounced value in the second quarter, led by Nvidia (NVDA), which surged over 40%. The ClearBridge Dividend Strategy, with its emphasis on quality, risk management and a disciplined approach to valuation, lagged in this momentum-driven tape.
The world has always been a dynamic place and investing has always required diving in without knowing exactly what lurks beneath. This market’s ability to shrug off bad news, however, beggars disbelief. For risk-averse investors like us, the list of concerns is as long as any we can recall. It is not just the laundry list of fears that makes us cautious, it is the intersection of these risks with record high prices that gives us pause. We can easily imagine being bullish amid political and economic doubts. Indeed, the best returns generally grow out of the most distressing times, provided the prices reflect the woes. The Great Depression, the Global Financial Crisis, the Covid pandemic — these painful periods provided the best buying opportunities for investors. The fundamentals were brutal, but they were fully reflected in prices. Not so today.
Global economics, politics, security and trade are changing profoundly, and nobody knows how things will shake out. We have significant concerns, but we will not belabor them here. In the long run — the very long run — investing is just math. A security is worth the present value of the future cash flows it generates. There is no ambiguity or uncertainty, and you need only two inputs to run the calculation: 1) the future stream of cash flows and 2) the appropriate interest rate for discounting those cash flows. If a risk-free investment pays $110 in 12 months and the prevailing interest rate is 10%, that investment is worth $100 today. It is as simple as that.
“While it is hard to gauge the right price for mega cap tech, we can say with certainty that current lofty valuations leave little room for error.”
In the real world, of course, valuing equity investments is not so simple, because the valuation calculation requires estimating the two critical inputs. Growth rates are uncertain because revenues fluctuate and profit margins ebb and flow. Interest rates oscillate constantly, making the discount rate a moving target. Valuation calculations are quite sensitive to fluctuations in the inputs, which is why equities are so volatile. We use a four-letter word to describe this part of the investment process: risk!
Because equity investing entails meaningful risk, it is prudent to demand a margin of safety in one’s investments. Today, however, with stocks priced to perfection, we see little room for error and hence little margin of safety.
The stocks in the Magnificent Seven represent over 30% of the S&P 500 and trade for over 30x earnings. This is twice the long-term average multiple of the S&P 500. These are fabulous companies with strong businesses and terrific financial profiles: they undoubtedly deserve premium valuations. But they are already the largest companies in the world and the law of large numbers ultimately catches up with everyone. The tech juggernauts operate in an incredibly dynamic sector and today’s winners are not guaranteed to dominate tomorrow. We do not know what the “right price” is for these stocks because we do not know how quickly they will grow or how interest rates will evolve. We can say with certainty, however, that such lofty valuations leave little room for error.
Interestingly, the tremendous confidence reflected in public market prices is not echoed by most corporate CEOs. Outside of the AI complex, management teams are unsure of how, where and whether to invest. In the short term, corporate and investor outlooks can diverge, but in the long run they must converge. If the corporate sector slows down, the market will follow. We have no idea which side is right, and indeed, we avoid picking sides. Current prices reflect scant chance corporate managements are correct, however, which seems an overly insouciant bet.
Portfolio Positioning
Despite our high-level cautiousness, we continue to find places to invest. Over the last year, we have increased our investments in communications services, energy, health care and consumer staples. These sectors are far easier to value and provide attractive upside and measured downside. In addition to being simpler to price than mega cap tech, these sectors are also much cheaper. As markets have soared despite rising interest rates, which through the higher discount rate reduce an investment’s value, we have actively positioned our portfolio in more conservatively valued securities.
Exhibit 1: ClearBridge Dividend Strategy Trading at a Meaningful Discount to the Market
As of June 30, 2025. Source: ClearBridge Investments, FactSet.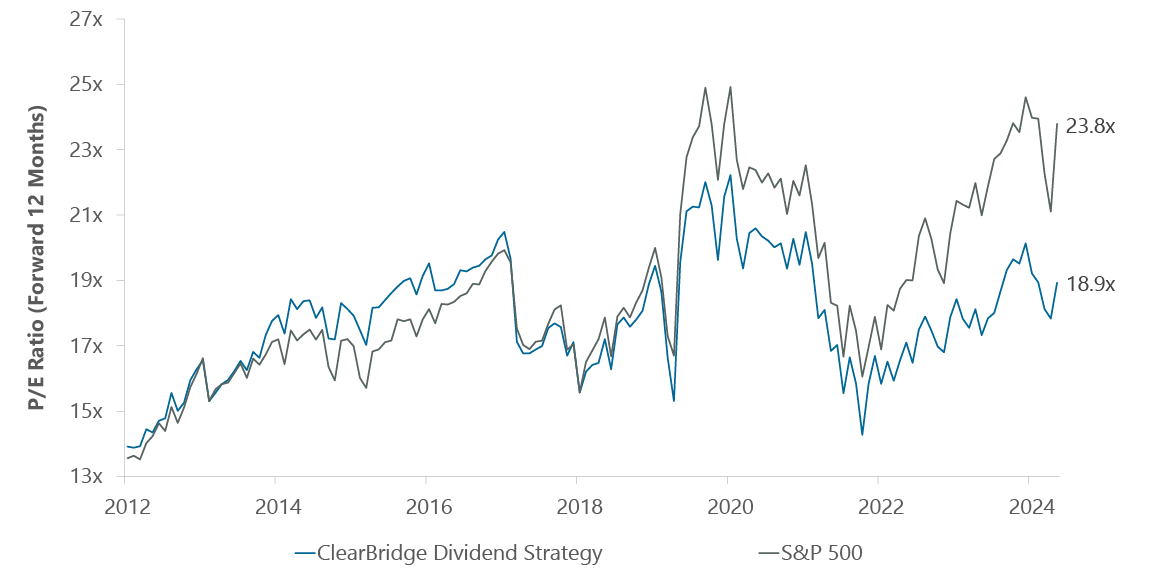
During the quarter we initiated a position in L3Harris (LHX), a defense company which had sold off on DOGE-related concerns. With armed conflict breaking out all over, robust defense spending seems like one of today’s few safe bets. L3Harris possesses a robust balance sheet and a strong outlook, and it offered an attractive entry point at a steep discount to the broader market in terms of free cash flow.
We also significantly increased our position in Exxon Mobil (XOM), as commodity weakness weighed on the shares, providing a compelling opportunity. Commodity prices are cyclical but the change underway at Exxon Mobil is secular. The company is simultaneously lowering its cost per barrel and reducing its emissions intensity while growing its production. This is a powerful combination that puts the company in its best position in decades. Exxon Mobil is positioned to deliver double-digit returns, even without any improvement in oil prices. If stagflation occurs, Exxon Mobil’s returns should be even higher, while most other stocks will come under pressure, providing a sturdy portfolio hedge.
“Our flexible approach to dividends enables us to invest in stocks with lower upfront yields, provided they offer compelling risk/rewards and the companies can significantly grow their dividends..”
Of course, what makes the ClearBridge Dividend Strategy unique is that we do not just invest in dividend stalwarts in communications services, energy, health care and consumer staples. Our flexible approach to dividends enables us to invest in stocks with lower upfront yields, provided they offer compelling risk/rewards and the companies can significantly grow their dividends. This is how we got to own Broadcom (AVGO) and Oracle (ORCL), two of the best AI plays around, (in addition to Apple (AAPL), Microsoft (MSFT), Visa (V) and others). But, unlike today, we built our positions in Broadcom and Oracle when their stocks embedded weak outlooks, not meteoric expectations (Exhibit 2).
We bought Broadcom at around a price/earnings of 11x in March 2020. Since then, we have taken profits at several points, but we still have a 3.4% position, making it our third-largest position. We bought Oracle in September 2020 when it was trading 14x earnings and investors were sour on the name. It has likewise performed well. We have taken gains along the way but still hold a large, but measured position, of 2.2%. We would be better off had we not trimmed our holdings, but investing requires making decisions probabilistically, without perfect knowledge of how the future will unfold.
Exhibit 2: Purchasing Stocks When They Embed Low Expectations: Valuations
As of June 30, 2025. Source: ClearBridge Investments, Bloomberg.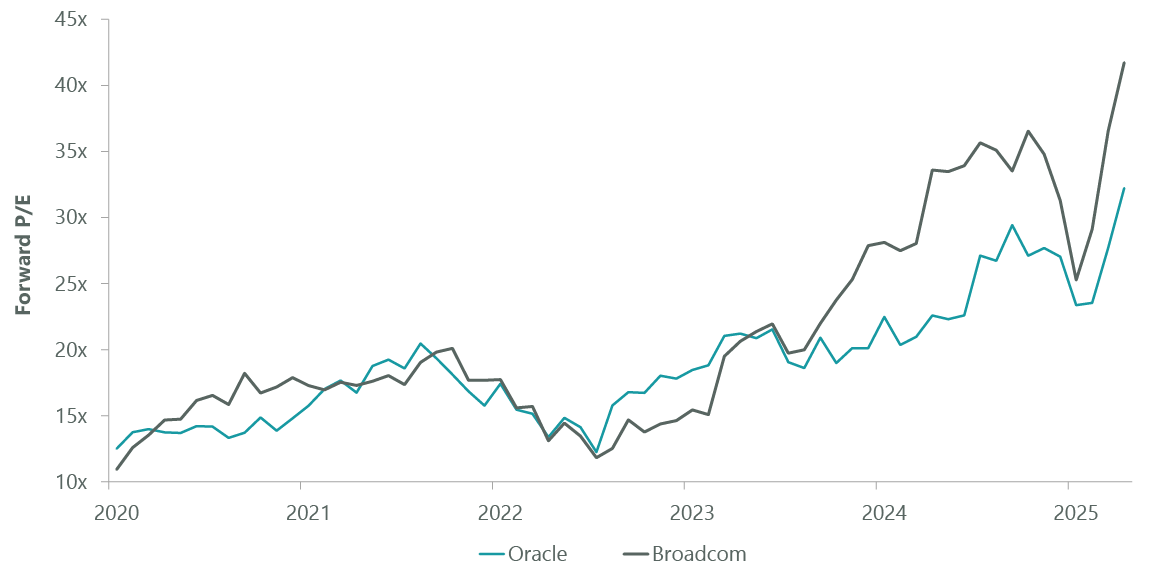
Reducing exposure as stocks become oversize, and as their valuation multiples expand, is the prudent thing to do, even if it weighs on relative performance. The S&P 500, as an index weighted by market cap, does not trim its winners; this has contributed to its sizable gains over the last few years. But the flip side of a passive, cap-weighted index is evident in today’s remarkable concentration (Exhibit 3), embedding tremendous risk whenever the market rolls over (Exhibit 4).
Exhibit 3: Market Remains Highly Concentrated
As of June 30, 2025. Sources: Standard & Poor’s, FactSet, and Bloomberg.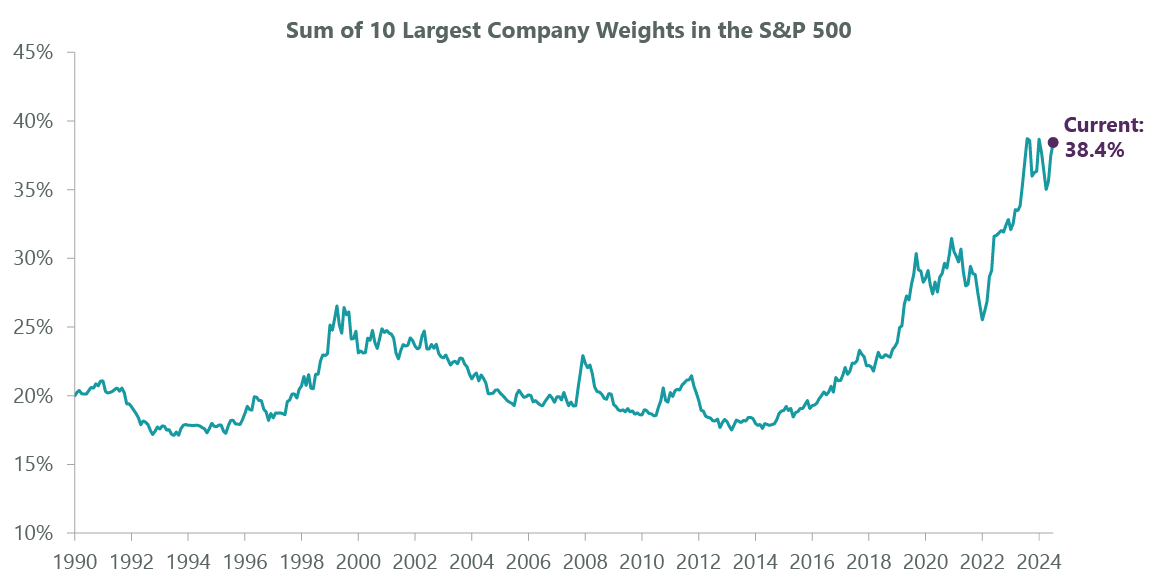
Exhibit 4: Concentration Leads to Broadening
Data shown is from Dec. 1989 – June 2025. Monthly constituent level market cap data. Data as of June 30, 2025. Sources: FactSet, Standard & Poor’s.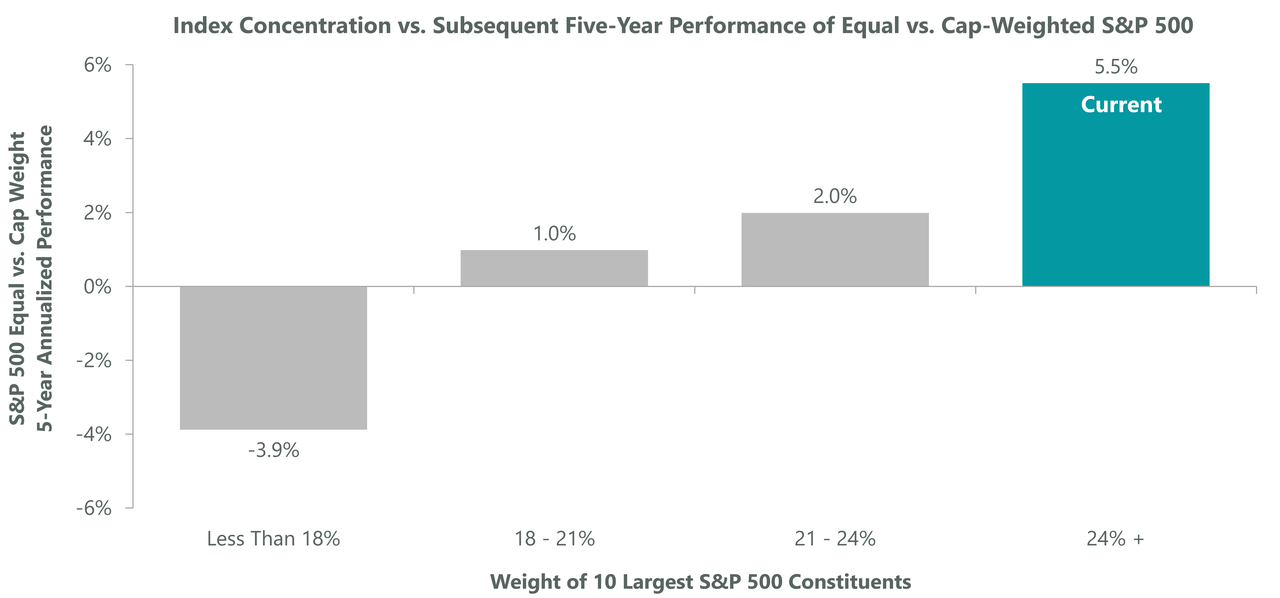
We have no idea what will happen with fiscal policy, tariffs, Iran or AI; we do not need to. Rather than trying to predict the future, we seek out individual securities embedding reasonable, risk-adjusted returns under a broad range of scenarios. It seems to us that risks abound, yet asset prices do not reflect this. We have harbored these concerns for several years, as market prices have been distorted ever since governments injected trillions of dollars in stimulus to combat Covid. It can be difficult to remain disciplined when everyone else parties like it’s 1999, but we fortify ourselves with the reminder that the music ultimately stops and the party ends.
We do not know where stocks will be six months from now, or six years from now, but the starting point suggests the market is poised for middling returns. The best returns come from purchases made when stocks are cheap. Nobody would argue stocks are cheap today.
Outlook
We continue to emphasize a diversified portfolio of high-quality companies compounding their dividends at attractive returns. Touting diversification may sound trite, but in today’s market it is no small feat. While the market has become incredibly concentrated, we have maintained a more traditionally diversified portfolio (Exhibit 5).
Exhibit 5: ClearBridge Dividend Strategy Remains Broadly Diversified
As of June 30, 2025. Source: ClearBridge Investments, FactSet.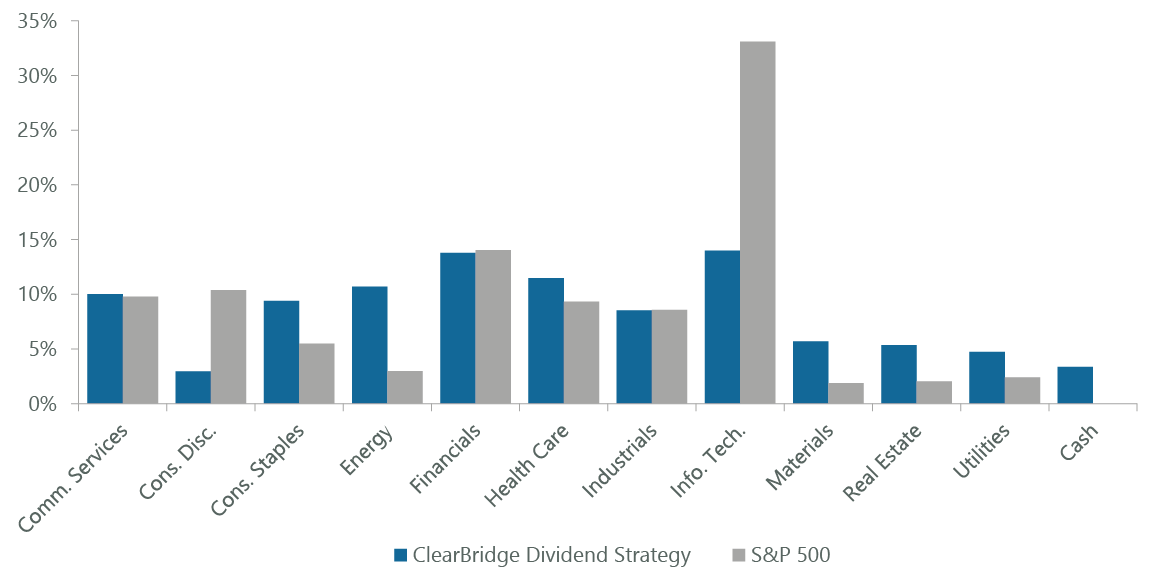
Exhibit 6: Dividend Growth Critical to Offset Inflation
As of Dec. 31, 2024. Source: FactSet, BLS, St. Louis Fed (FRED), Federal Reserve Bank of Minneapolis. *Includes variable dividends from PXD, CHK. **2023 and 2024 Nominal Dividend Growth calculated using 2022 dividend growth excluding PXD, CHK; 2024 CPI as of Nov. 2024.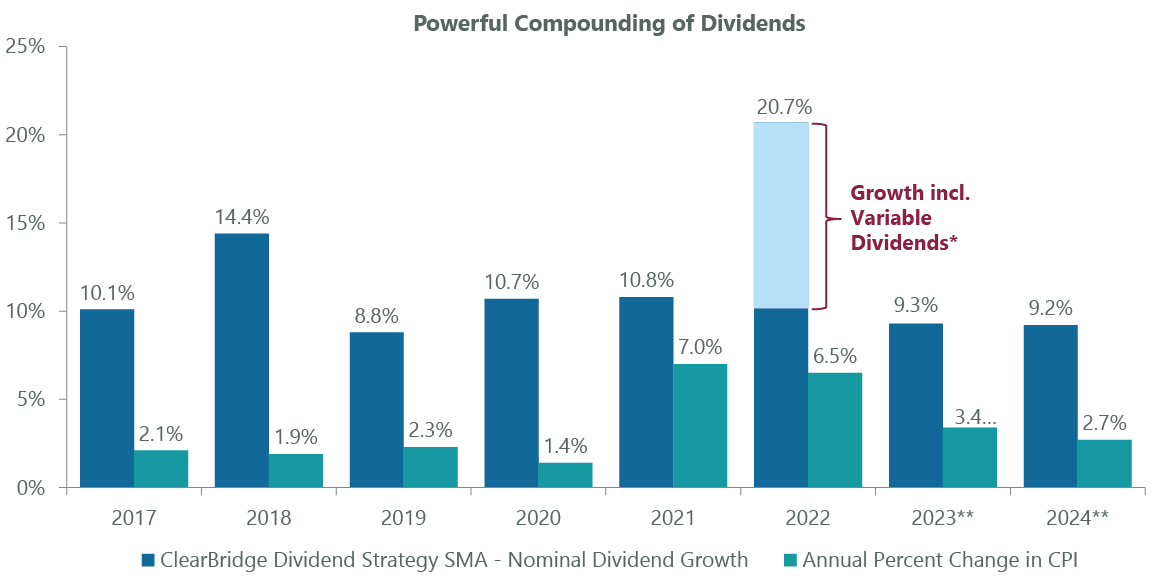
Over the last eight years our average portfolio company has grown its dividend by 7%, well in excess of inflation, and we see no reason that cannot continue (Exhibit 6). As inflation expectations become more entrenched and stagflation becomes a concern, dividend growth will become increasingly critical. Dividends act as an anchor to windward, stabilizing our portfolio during bouts of volatility. With elevated uncertainty likely an enduring feature of the current era, the course we chart should serve us well.
Portfolio Highlights
The ClearBridge Dividend Strategy underperformed its S&P 500 Index benchmark during the second quarter. On an absolute basis, the Strategy saw positive contributions from eight of 11 sectors in which it was invested for the quarter. The IT, financials and communication services sectors were the main positive contributors, while the health care sector was the main detractor.
On a relative basis, stock selection and sector allocation contributed negatively to performance. In particular, an underweight to IT and an overweight to energy, as well as stock selection in the communication services, health care and industrials sectors weighed on relative results. Conversely, stock selection in the energy and IT sectors was positive.
On an individual stock basis, the main positive contributors to relative returns were Apple, Oracle, Broadcom, TE Connectivity and Walt Disney. Positions in Becton Dickinson (BDX), T-Mobile (TMUS), Microsoft, Exxon Mobil and UnitedHealth Group (UNH) were the main detractors from relative returns in the quarter.
In addition to portfolio activity discussed above, during the quarter we exited PPG Industries (PPG) in the materials sector and General Motors (GM) in the consumer discretionary sector.
John Baldi, Portfolio Manager
Michael Clarfeld, CFA, Portfolio Manager
|
Past performance is no guarantee of future results. Copyright © 2025 ClearBridge Investments. All opinions and data included in this commentary are as of the publication date and are subject to change. The opinions and views expressed herein are of the author and may differ from other portfolio managers or the firm as a whole, and are not intended to be a forecast of future events, a guarantee of future results or investment advice. This information should not be used as the sole basis to make any investment decision. The statistics have been obtained from sources believed to be reliable, but the accuracy and completeness of this information cannot be guaranteed. Neither ClearBridge Investments, LLC nor its information providers are responsible for any damages or losses arising from any use of this information. Performance source: Internal. Benchmark source: Standard & Poor’s. |
Original Post
Editor’s Note: The summary bullets for this article were chosen by Seeking Alpha editors.
Read the full article here
")
 Q4 2025 Earnings Call Transcript")


")